Initial concepts
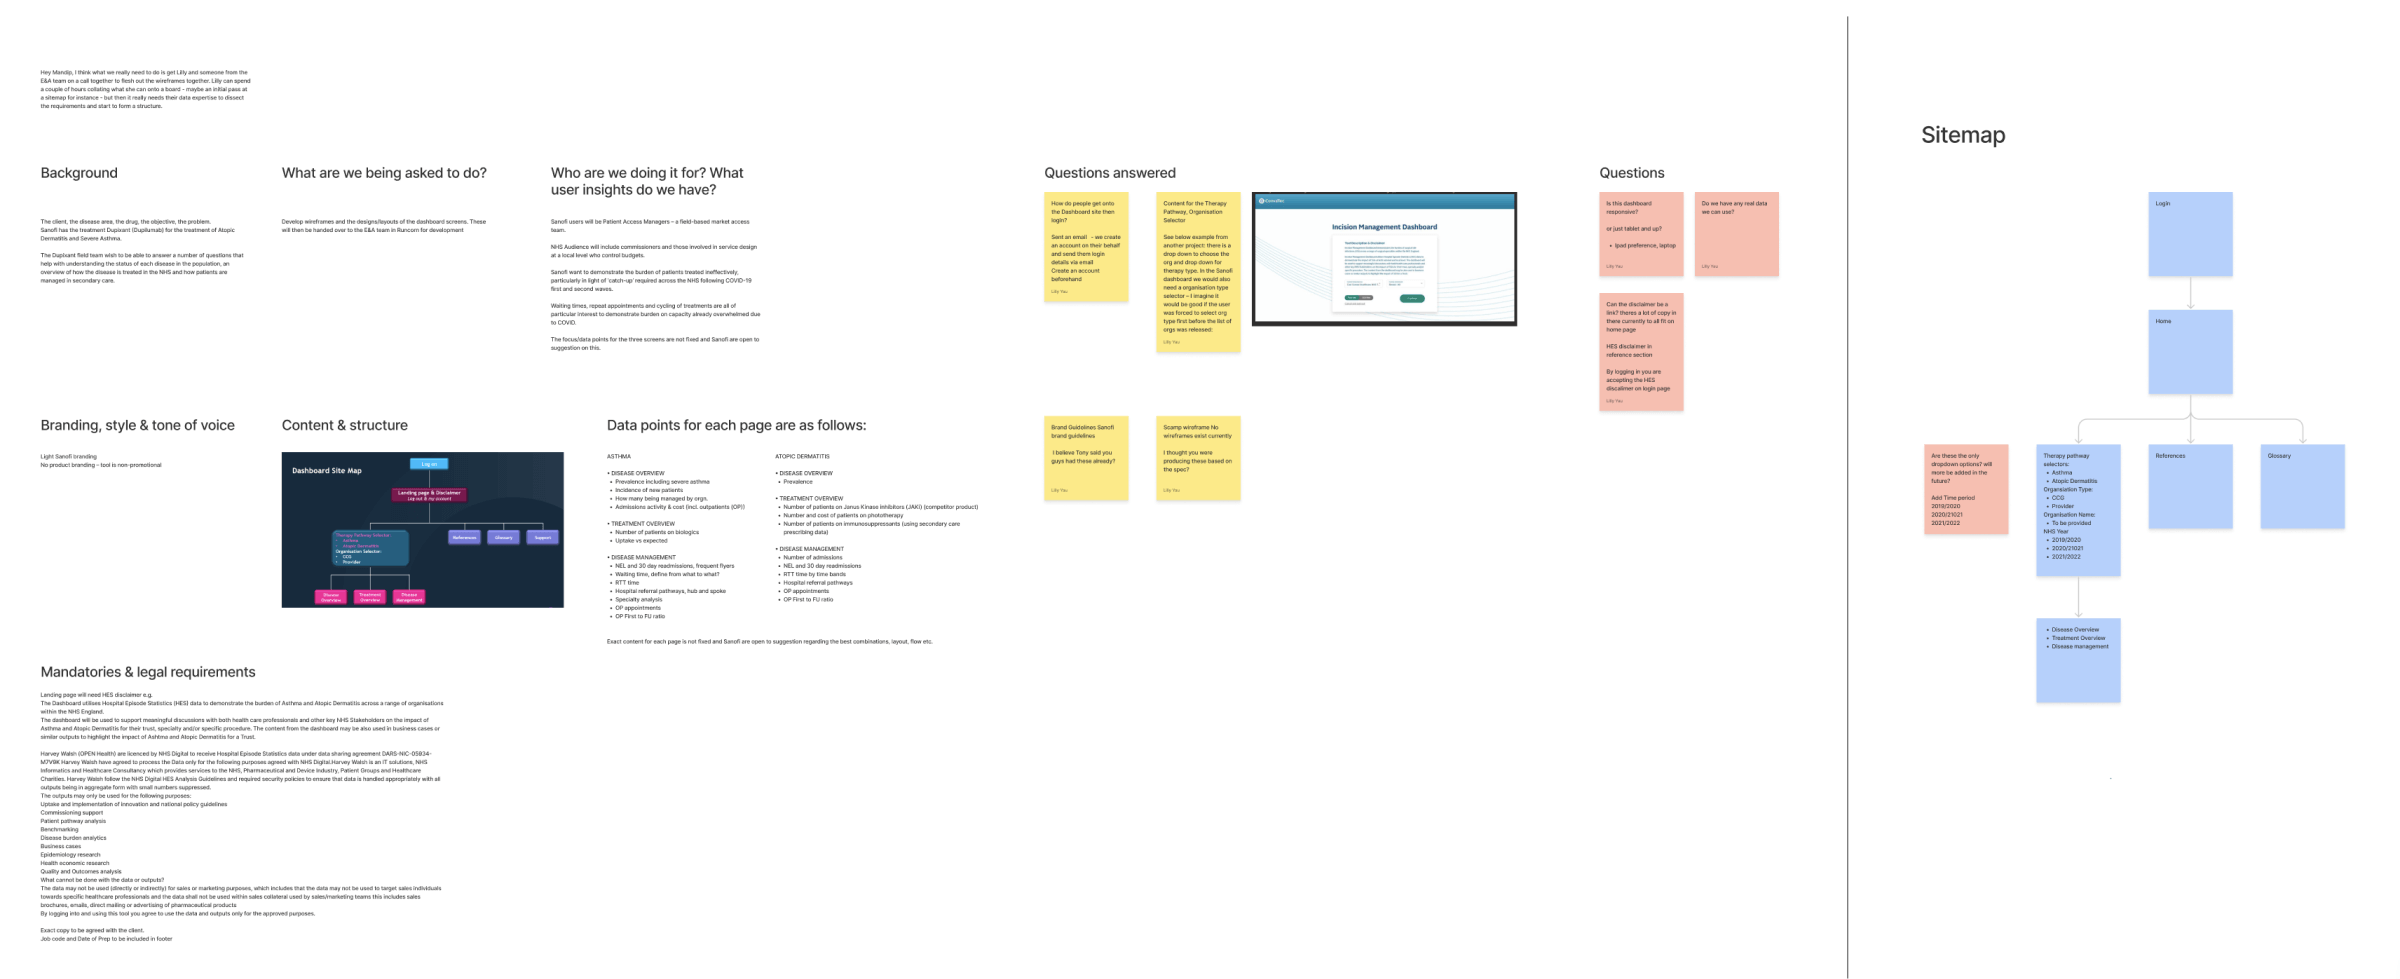
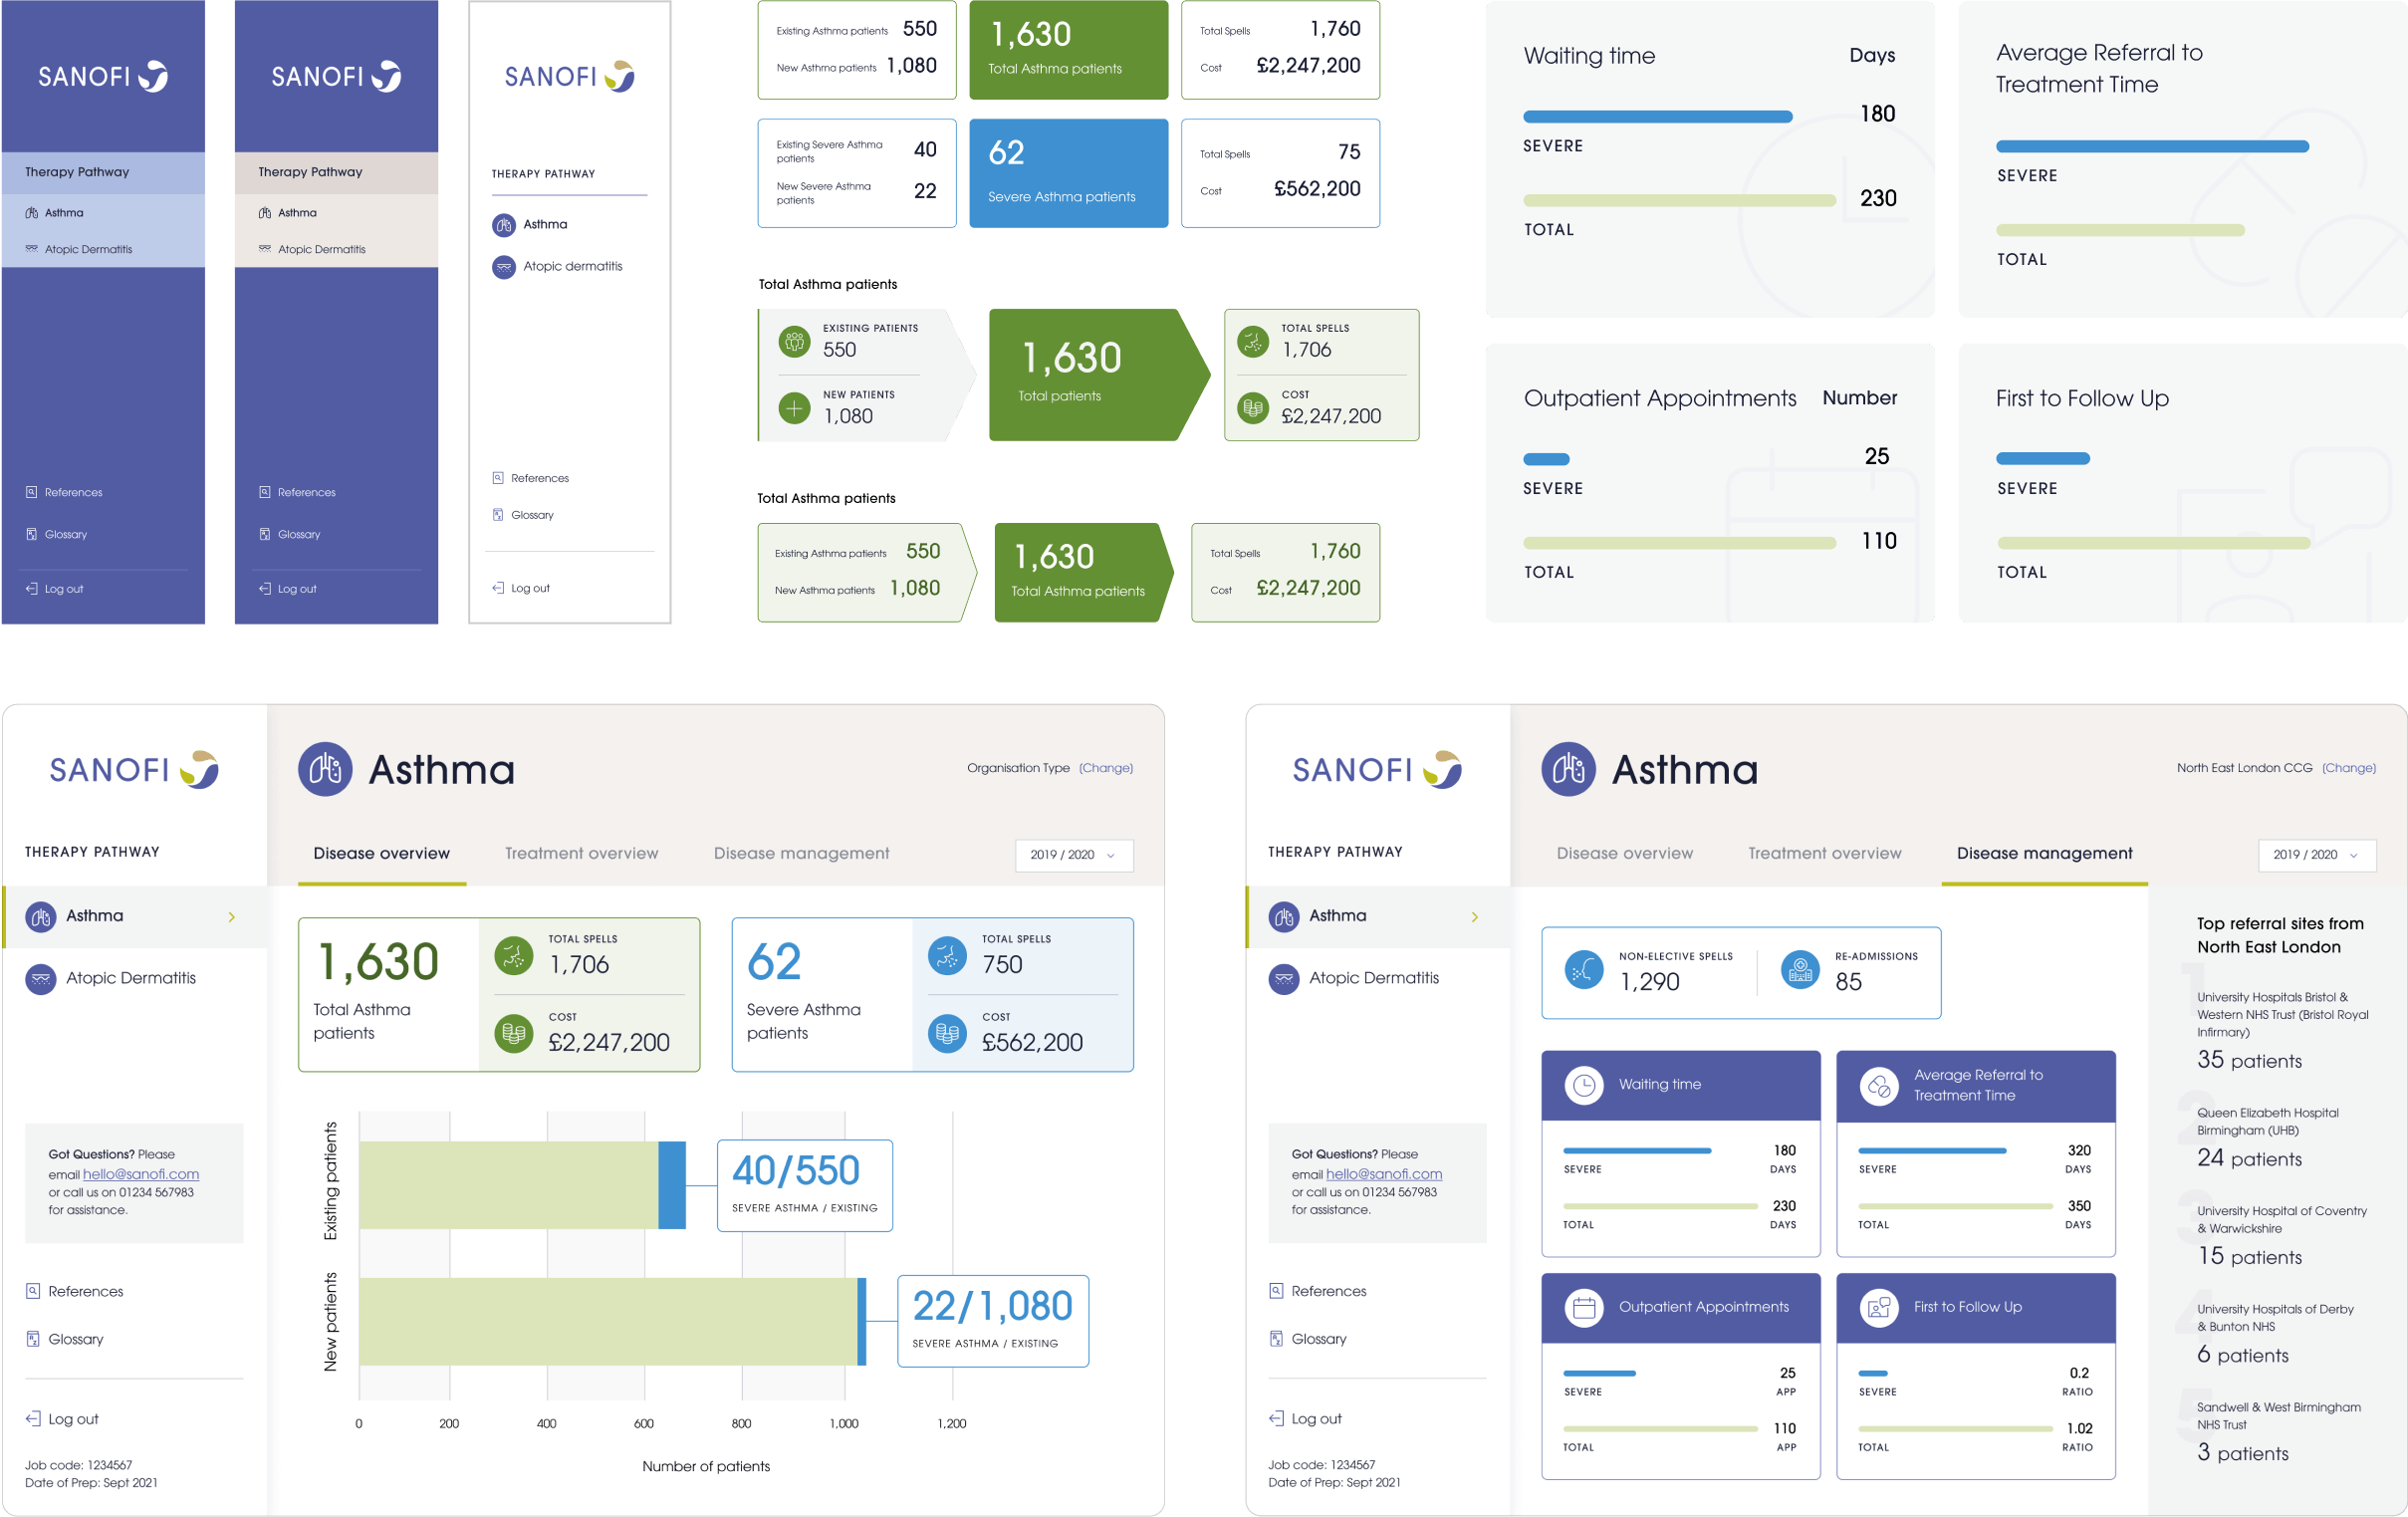
I began by drawing inspiration from various dashboards and data visualisation designs to generate initial ideas.
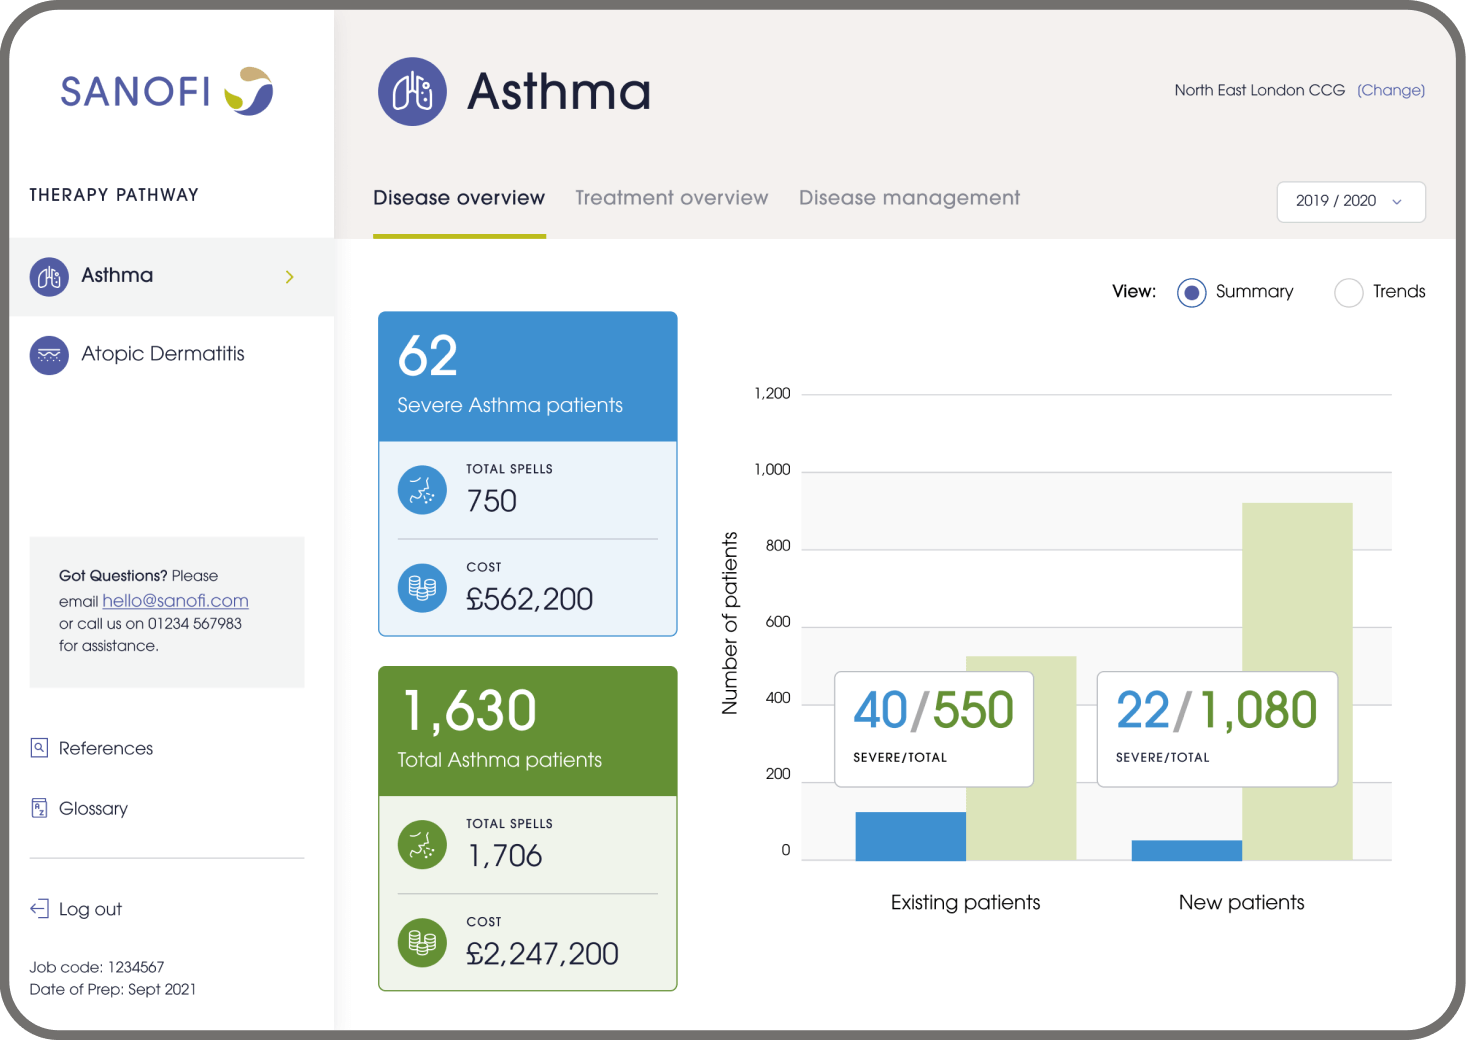
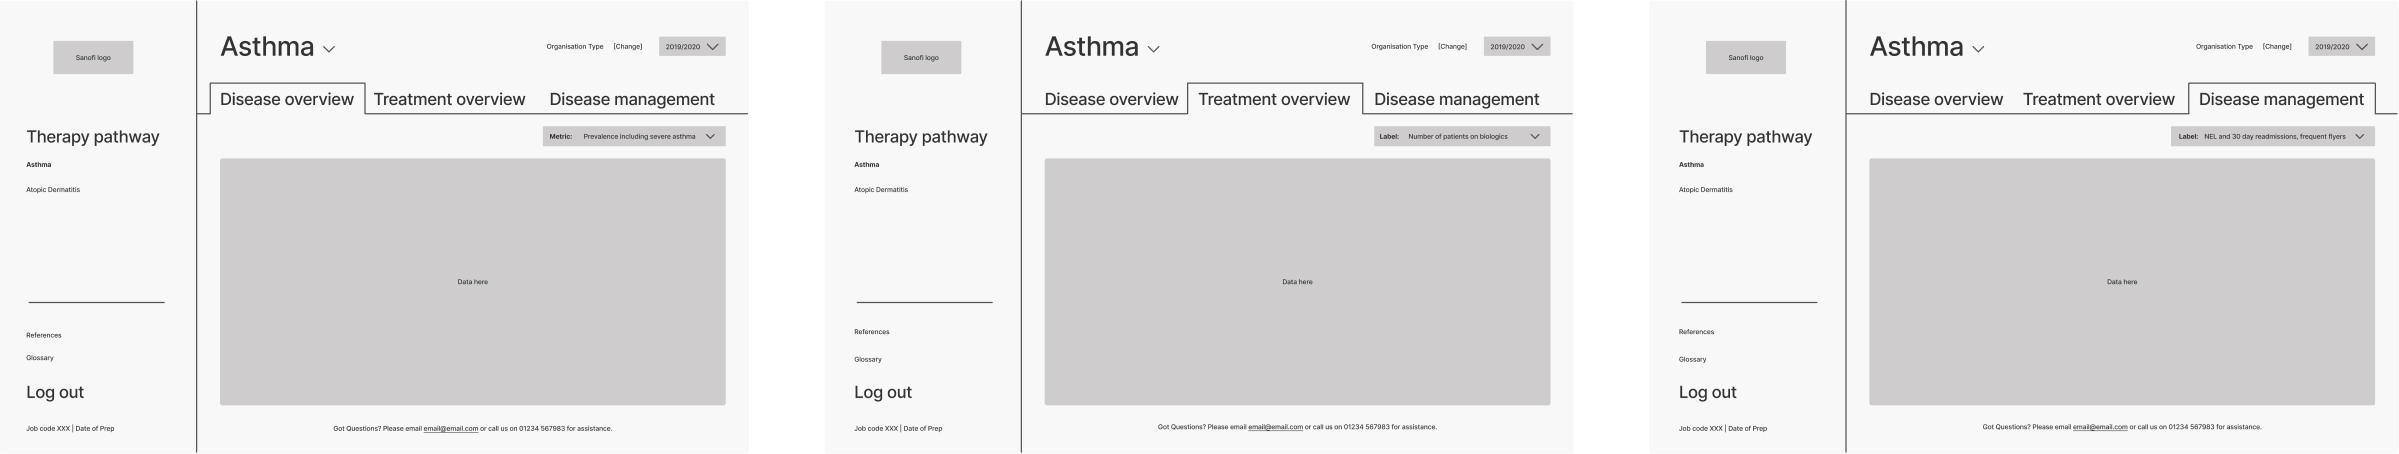
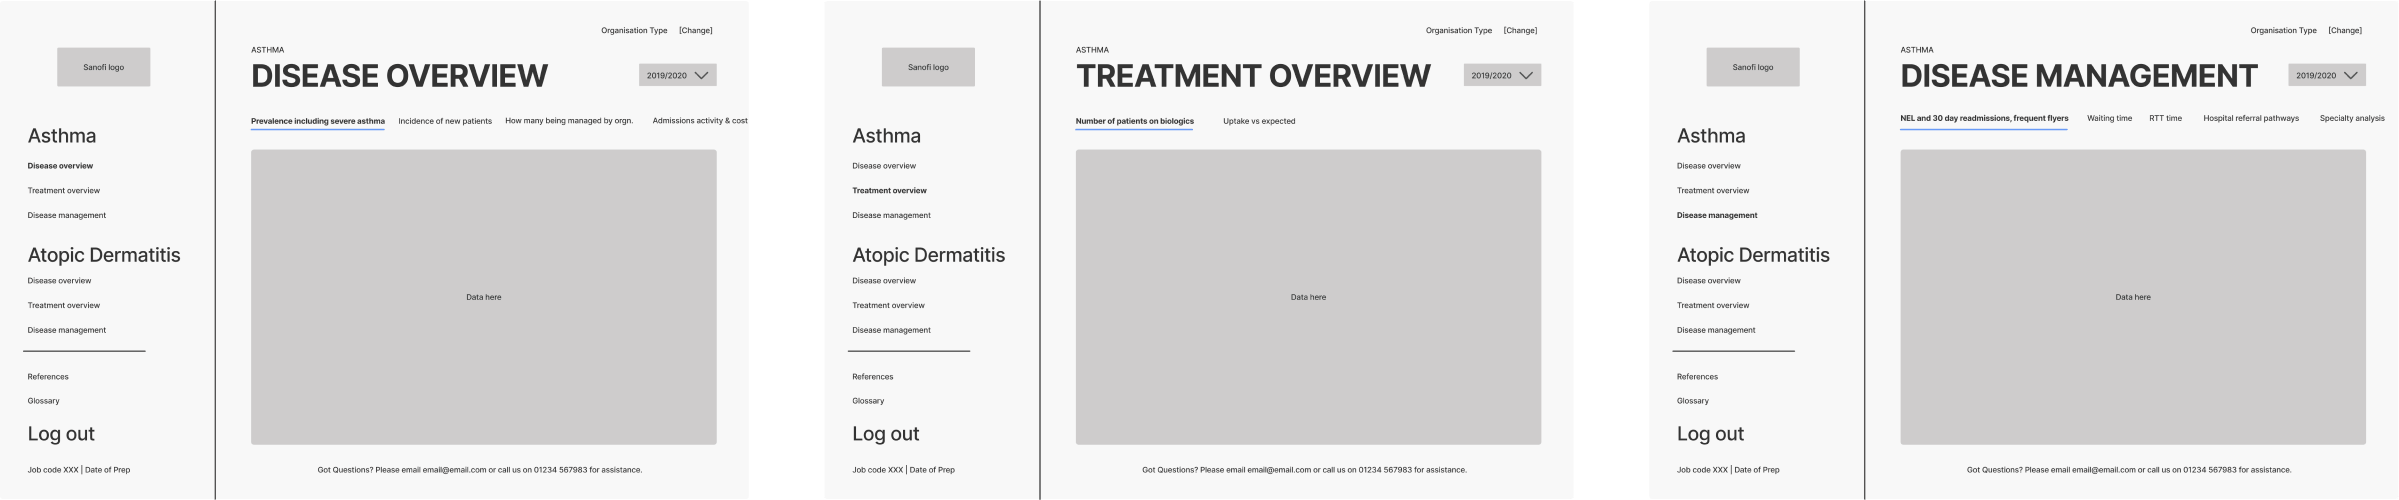
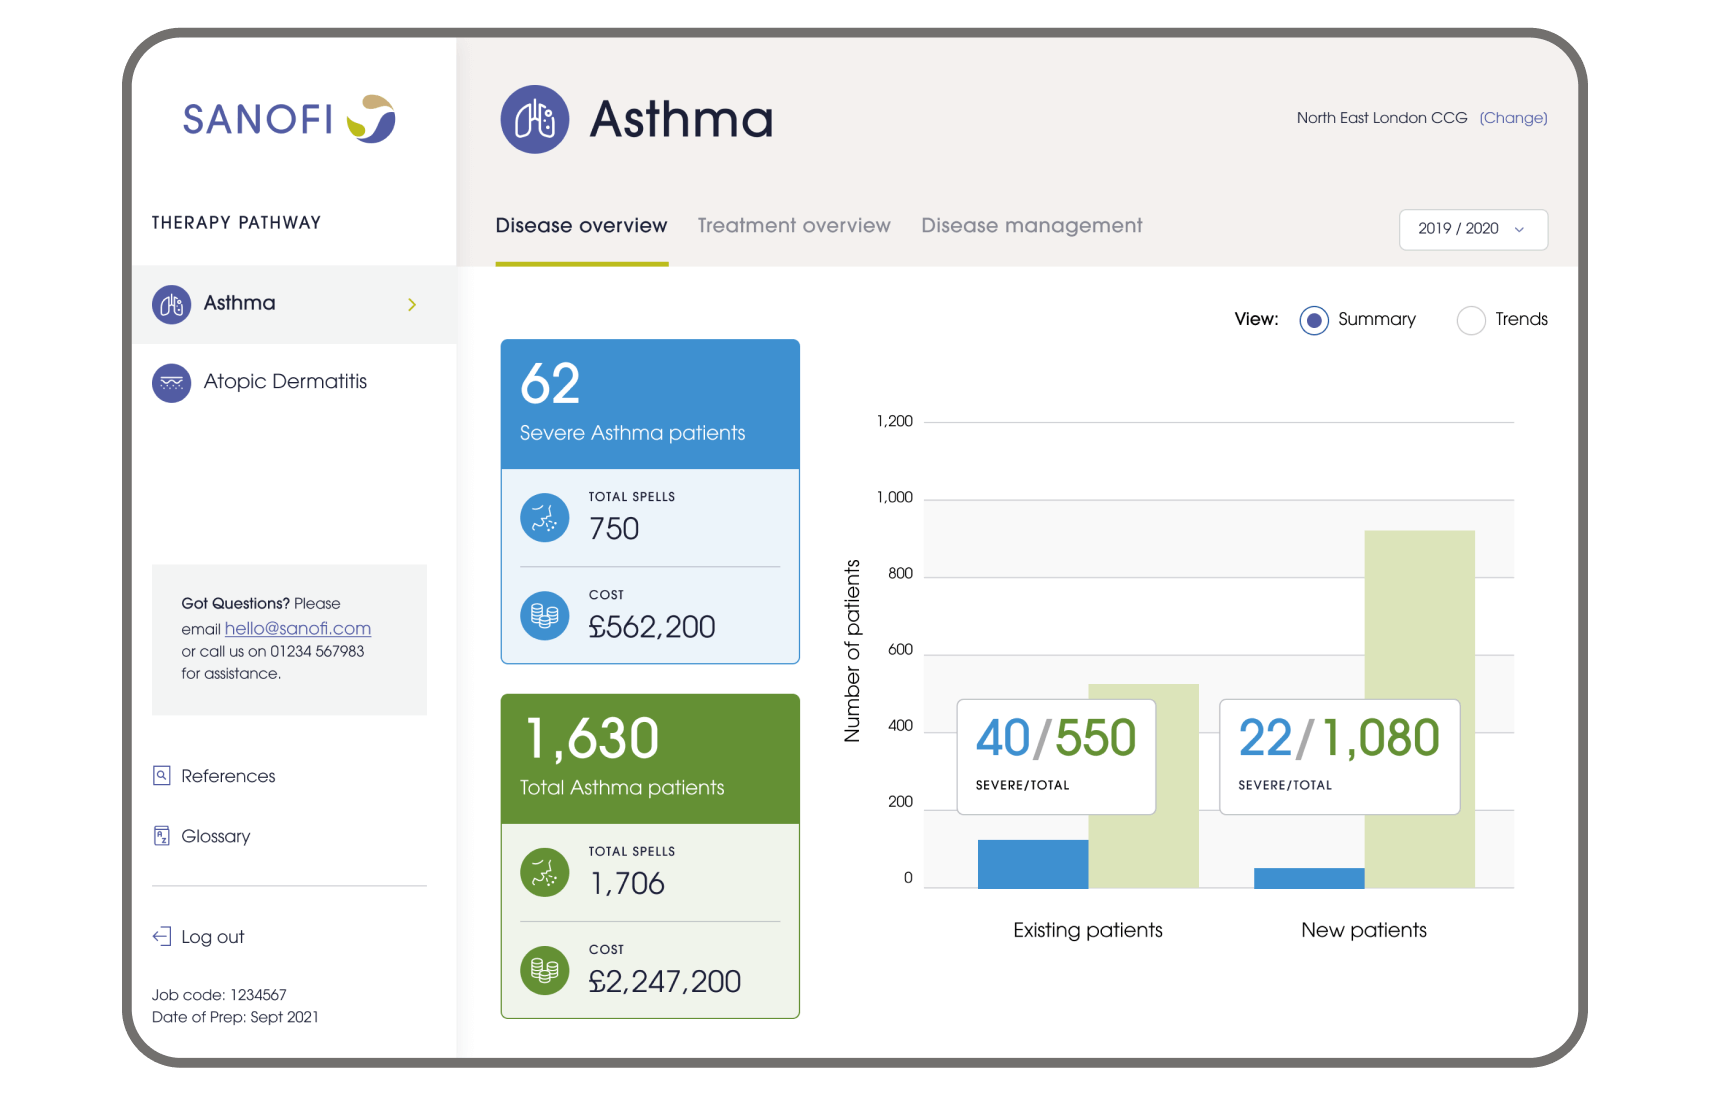
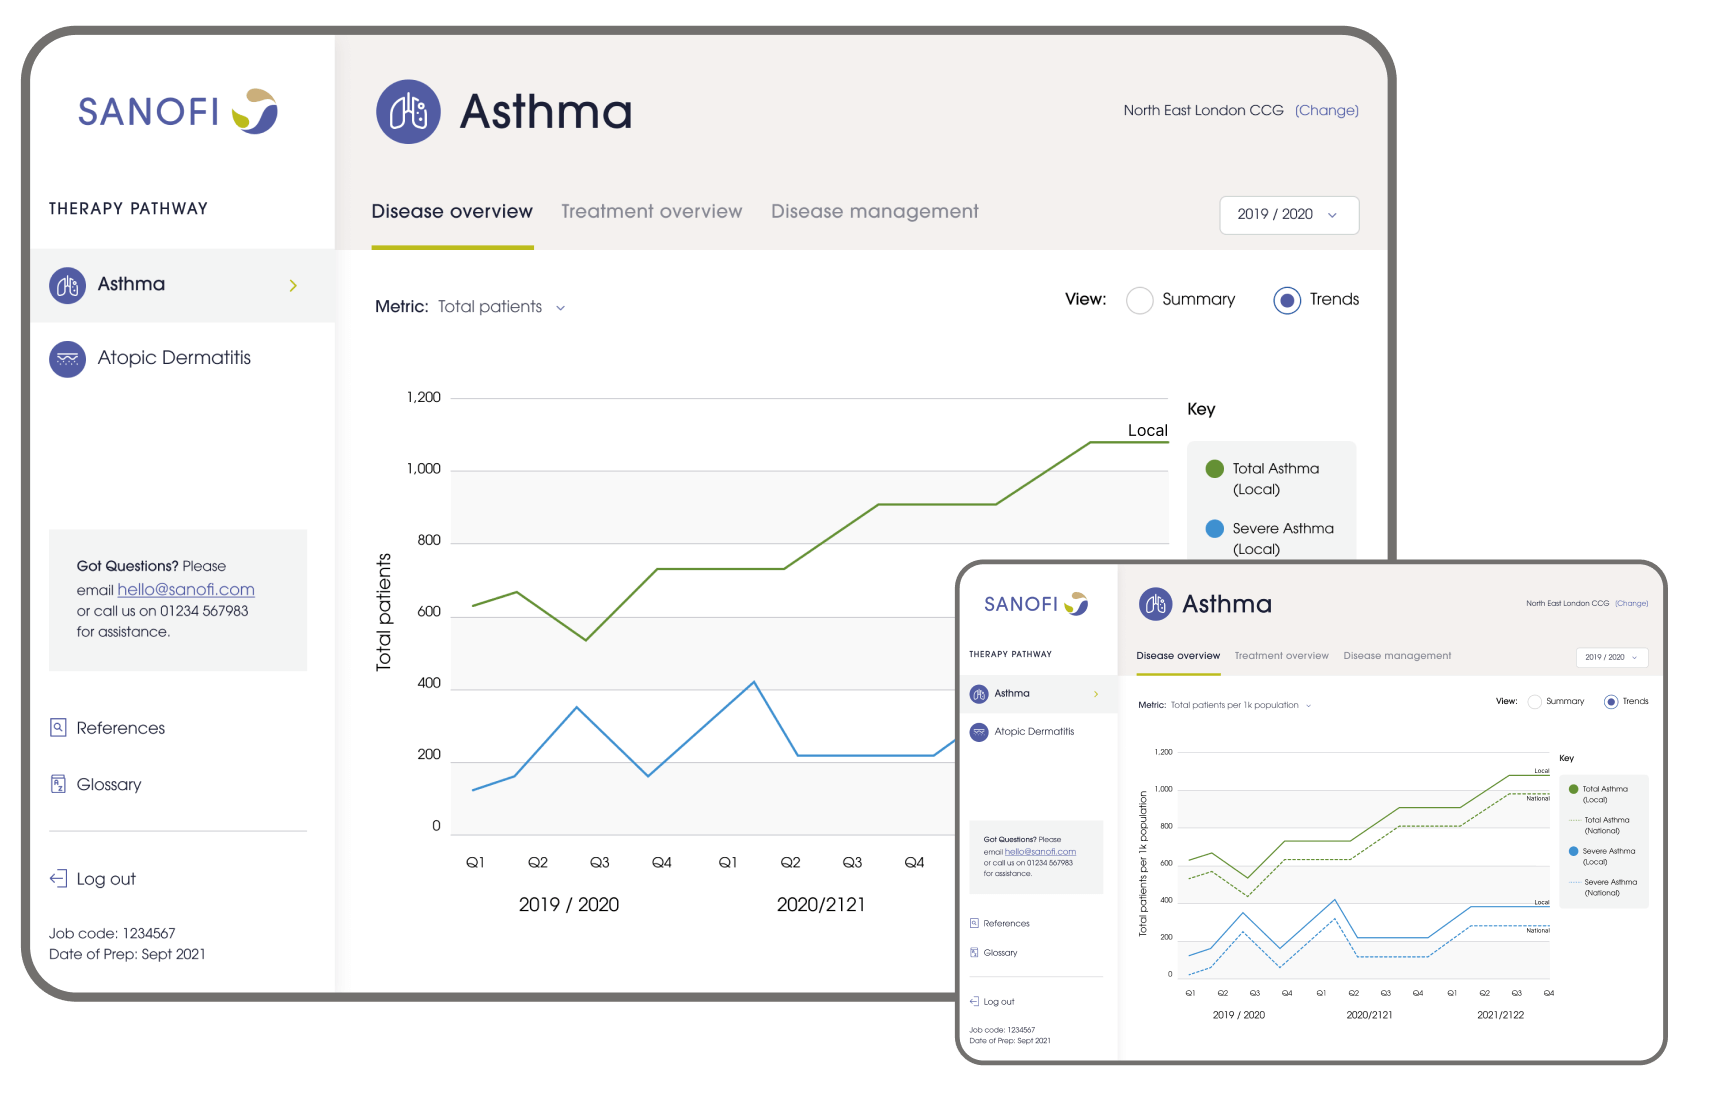
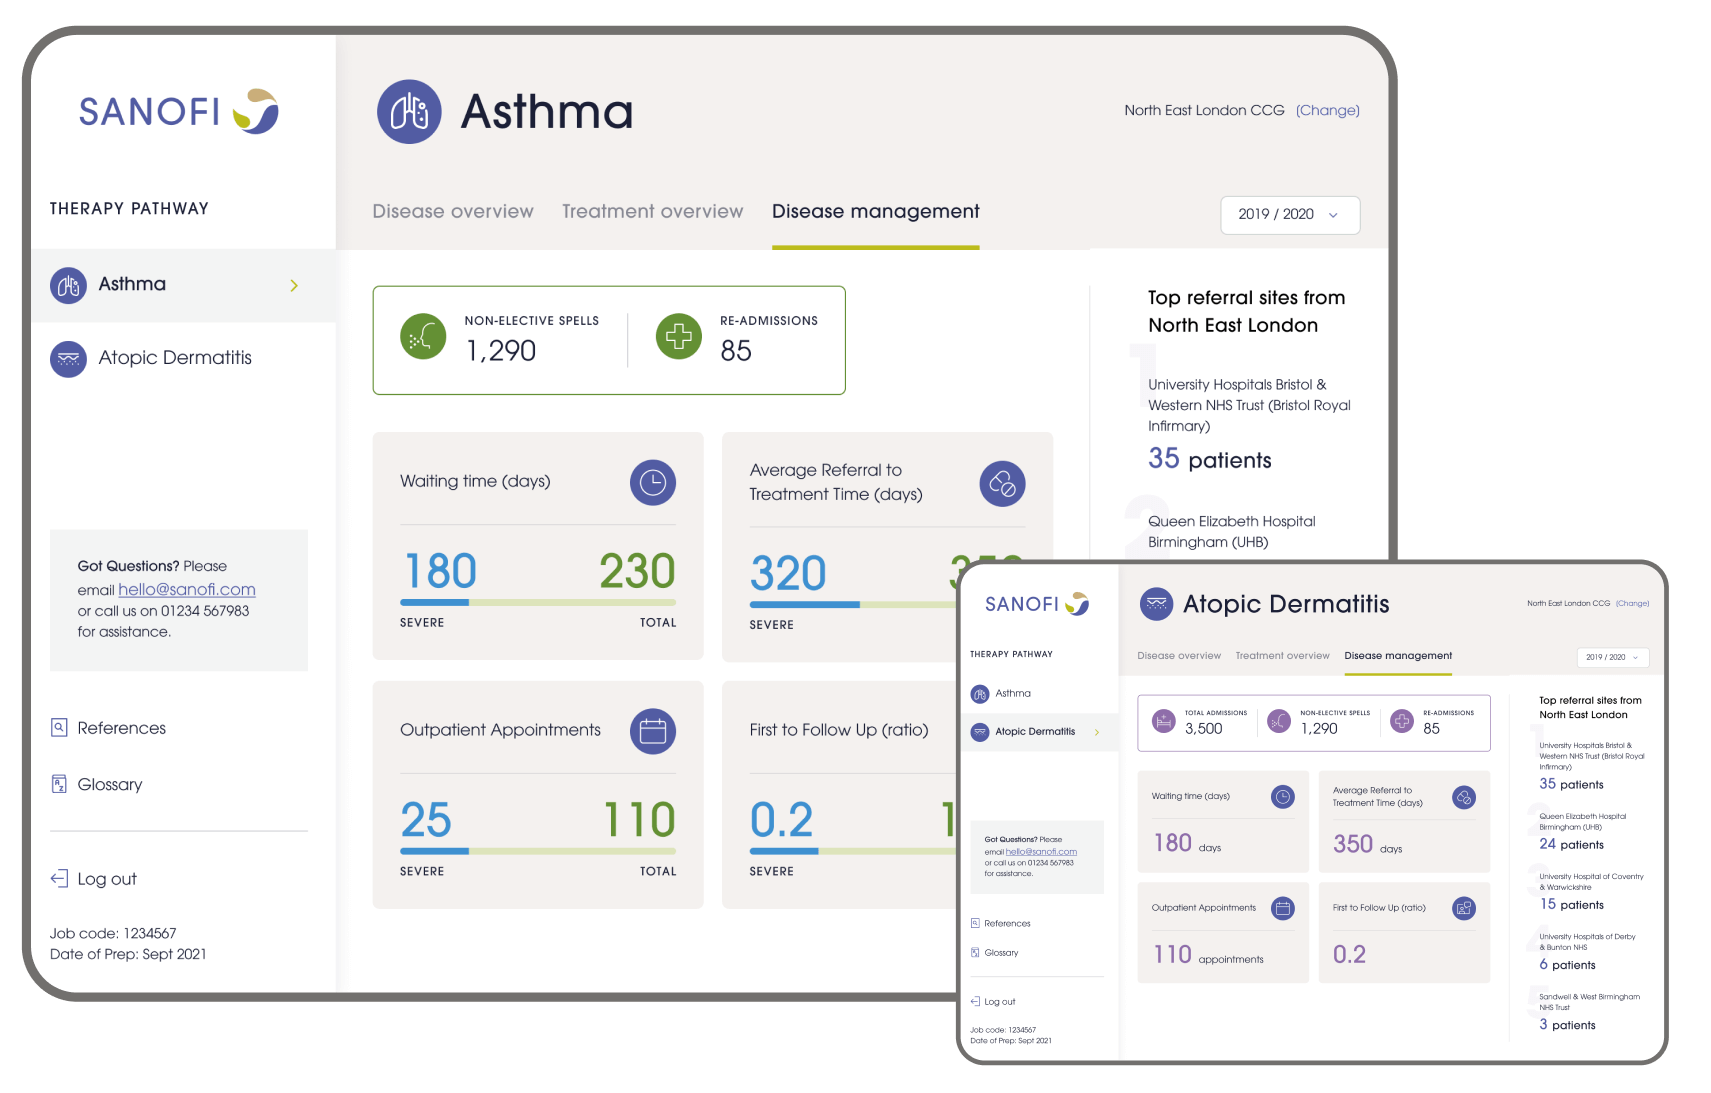
These concepts were sketched out on paper before transitioning to Figma for further refinement. Throughout the process, I explored numerous iterations of the dashboard design, ensuring alignment with brand guidelines.
The biggest challenge I faced when designing was ensuring that the data, which needed to be translated into graphs and other visual elements, would be easily understandable for patient access managers.
Given my limited expertise in the scientific aspects of the data, close collaboration with the scientific copywriter was essential. This collaboration ensured that the designs accurately conveyed the intended information and effectively communicated key insights to the target audience.